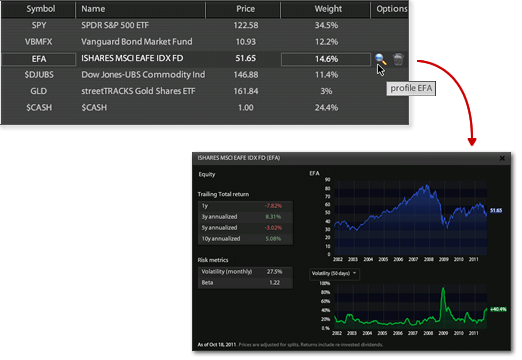
To display a stock, ETF, or mutual fund volatility, bring up the Asset Profile view by clicking on the magnifier icon in the main portfolio table, as show below. The volatility chart is show at the bottom of the Asset Profile view.

The volatility is computed as the standard deviation of the last 50 days of returns. Consequently, the volatility chart show the rolling 50 days standard deviation.
Portfolio volatility
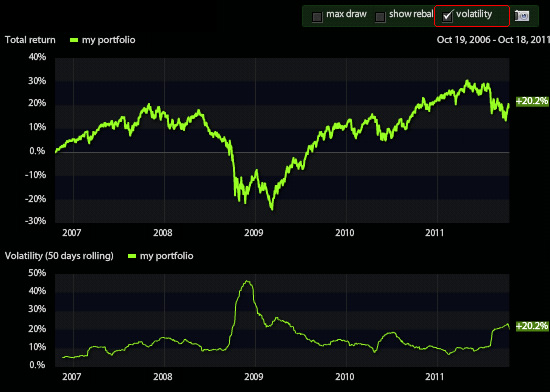
You may also chart the volatility of entire portfolios. To display a portfolio volatility, go to the Backtest view, return chart, and select volatility as shown below. The volatility chart appears below the portfolio return chart:

In this view, it is also possible to compare the portfolio volatility with a benchmark volatility. Simply use the Backtest compare function to add the benchmark volatility to the chart.
