Now available to all subscribers at no extra cost
Kwanti has always been powerful when it comes to deep analytics of your portfolios and models, and we are constantly looking for ways we can add more useful tools for users, as well as make enhancements to existing features. Introducing our latest enhancement: identifying hidden portfolio expenses and tax liability with Tax Drag analysis.
Investing involves many hidden costs that reduce returns. It’s important for advisors to not only identify these costs in portfolios but also demonstrate and explain them in an understandable fashion to clients. One that is more straightforward is expense ratio for funds held in a portfolio. Funds with high expense ratios will drag down returns. A topic that is more difficult to analyze is Tax Efficiency. One way of measuring this is by looking at the tax drag, aka the tax liability triggered by distributions and capital gains.
Tax drag can have a significant effect on overall performance, and tax-efficient investing techniques are important for recognizing capital gains, transferring wealth, and estate planning. Showing clients the impact of taxes between different investments can help them understand the importance of tax planning when investing. By reducing tax liability, the money saved stays invested and then compounds over time.
Our Tax Drag analysis is designed to shed light on the ‘hidden’ expenses of your portfolios and models in a clear and demonstrable manner. For Kwanti users, the portfolio expenses analysis has been invaluable in understanding how high expense ratios can affect and drag down portfolio returns. Now, with our new Tax Drag analysis, advisors can efficiently showcase the significant impact of inefficient tax management on portfolio returns. ‘Fund expenses’ and ‘Tax drag’ now make up our improved Expenses tab in Kwanti.
Identify hidden costs and expenses
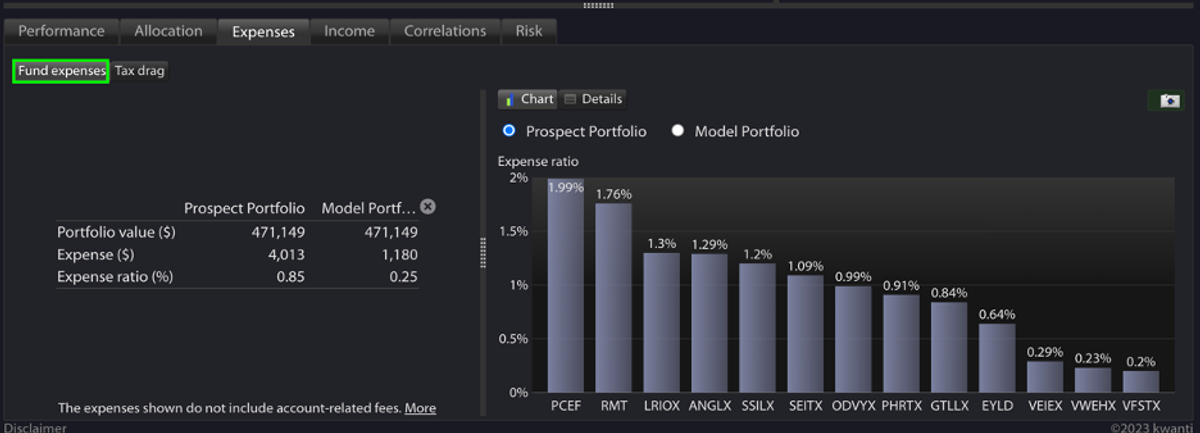
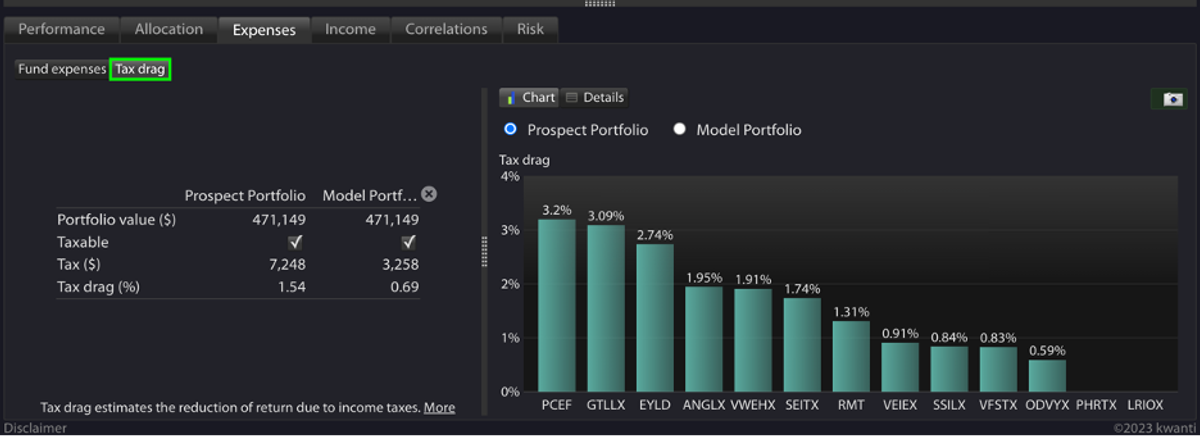
First, open up a portfolio you’d like to view the expenses on, and click on the Expenses tab. You’ll now see two tabs for ‘Fund expenses’ and ‘Tax drag’.
Within ‘Fund expenses’, you can view the net expense ratio of the portfolio, as well as it broken out into detail by position. This helps advisors easily identify areas of potential portfolio drag.
Within ‘Tax drag’, you can view the tax liability and the tax drag percentage of the portfolio, which estimates the reduction of return due to income taxes. This can also be broken out into detail by position.
Compare to other portfolios
As always, everything in Kwanti can be viewed in comparison to another portfolio, whether that be a model portfolio, a proposed portfolio, or some type of benchmark. This allows advisors to easily identify positions with a high tax drag, to potentially find replacement assets with Kwanti Screener, and to easily demonstrate to clients the benefits of switching to a proposed portfolio.
Reducing investment costs and tax drag – which in turn leads to increased returns and greater portfolio performance – starts with being able to identify these hidden costs, and our new Tax Drag analysis gives advisors greater ability than ever to do so.
View more details in our documentation.
Webinar
We will be holding a webinar on August 16th at 4pm ET to cover our recent enhancements (including Tax Drag) in more detail, to discuss the TD/Schwab merger as it relates to Kwanti users, and to answer any questions you may have. Please click here to register.